

Microsoft Fabric for manufacturing
Microsoft Fabric unifies plant, sensor and supply chain data in one lakehouse so manufacturers can see production performance in real time. Veratas designs, builds and runs that platform as one accountable team.
Manufacturing data is fragmented across the plant floor and the back office
Most manufacturers hold the data they need to lift output, but it is scattered across systems that were never designed to work together.
A typical plant generates data in historians, MES and SCADA systems, programmable controllers, quality systems and an ERP, often Dynamics 365. Each system answers part of the question. None of them gives operations leaders a single, trustworthy view of how a line is actually performing shift to shift.
The result is familiar. OEE is calculated in spreadsheets that lag a day or more behind the line. Downtime reasons are recorded inconsistently. Scrap and yield numbers cannot be tied back to a specific batch, machine or operator. Planners and quality teams spend more time reconciling figures than acting on them.
Microsoft Fabric addresses this by bringing every source into OneLake, a single tenant-wide data lake, without forcing a rip and replace. High-frequency sensor and historian data lands through Real-Time Intelligence, batch and transactional data through Data Factory pipelines, and the lakehouse becomes the one place production, quality and supply chain data is modelled, governed and reported.
What manufacturers build on Microsoft Fabric
Fabric supports the analytics that operations, quality and supply chain teams need from one consistent platform.
Real-time OEE and line performance
Stream historian and machine data into Fabric Real-Time Intelligence to track availability, performance and quality as production runs. Operators and supervisors see accurate OEE on the line rather than in a report the next morning.
Downtime and loss analysis
Combine event data, downtime reasons and shift records in the lakehouse to find the true causes of lost time. Pareto and trend analysis in Power BI lets engineering target the constraints that actually limit throughput.
Quality, scrap and yield
Tie quality results, scrap and rework back to specific batches, machines, materials and operators. Genealogy held in OneLake supports faster root cause analysis and tighter control of cost of poor quality.
Supply chain and inventory visibility
Bring Dynamics 365 and supplier data alongside production data to connect demand, materials and output. Teams can see where inventory and supply constraints will disrupt the schedule before they reach the line.
Predictive maintenance foundations
Use Fabric notebooks on historian and condition-monitoring data to model failure patterns and asset health. This gives reliability teams the data foundation to move from scheduled to condition-based maintenance.
How Veratas delivers Microsoft Fabric for manufacturing
We deliver Fabric as a single accountable engagement, from plant data sources through to dashboards on the line.
Assess the plant data estate
We map your historians, MES, SCADA, quality systems and ERP, agree the OEE and loss definitions that matter, and set the target Fabric architecture against measurable production outcomes.
Build the lakehouse and pipelines
We land historian and sensor data through Real-Time Intelligence and batch data through Data Factory, then model a governed production lakehouse in OneLake with consistent definitions for every line and site.
Deliver analytics on the line
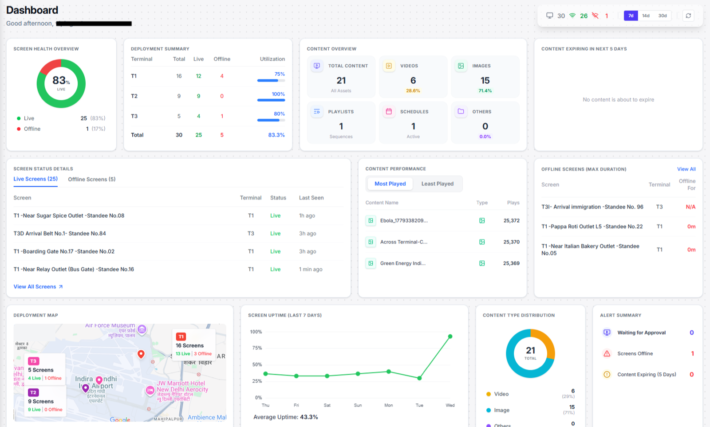
We build Power BI reports on Direct Lake so OEE, downtime, quality and supply data refresh at production speed, and we make them usable on plant floor screens, not only at a desk.
Govern and run the platform
We apply Purview governance, lineage and access control, then run Fabric as a managed service so capacity, pipelines and reports stay reliable as you add lines and sites.
FAQ
Frequently asked questions
Quick answers to questions you may have. Can't find what you're looking for? Check out our full documentation.
Related industry solutions
Other ways Veratas applies Microsoft and data engineering to industry-specific challenges.
Microsoft Fabric for energy and utilities
Microsoft Fabric brings grid, asset and operational data into one lakehouse so energy and utility operators can monitor networks and meet regulatory demands.
Microsoft Fabric for financial services
Microsoft Fabric brings risk, customer and transaction data into one governed lakehouse so financial services firms can report, manage risk and serve customers with confidence.
Power BI for manufacturing
Power BI turns production, quality and supply data into plant dashboards your teams act on every shift.
Turn plant data into production performance
Book a discovery call to scope Microsoft Fabric for your plants. We will review your current systems and agree a practical path to real-time production analytics.