



Data visualisation: Power BI that people actually use
A dashboard nobody trusts is worse than no dashboard. Veratas builds Power BI that earns trust: well-modelled semantic layers, clear executive reporting, and a self-service capability your teams genuinely adopt, so reports drive decisions instead of starting arguments.
Why dashboards lose the room
Most failed Power BI is not a charting problem. It is a modelling problem and an adoption problem.
The fastest way to kill a reporting project is to show two dashboards that disagree. A leadership team sees revenue stated one way on the sales report and another way on the finance report, and from that moment every figure is suspect. The meeting turns into a debate about the tool instead of the business. The charts themselves are usually fine. The problem sits underneath them, in how the data was modelled and how each measure was defined.
This happens because reports are too often built directly on raw data, with each report author writing their own logic. One defines revenue net of returns, another gross. One filters to a fiscal calendar, another to a calendar year. Multiply that across dozens of reports and self-service users, and the estate has no single version of the truth, just many confident contradictions. No amount of visual polish fixes a foundation that disagrees with itself.
The second failure is quieter. A technically correct dashboard is delivered, and then nobody uses it. It answers questions the users were not actually asking, or it requires training they never received, so people quietly return to their spreadsheets. Visualisation that is not adopted has not succeeded, regardless of how good the build is. We treat the model and the adoption as core deliverables, not optional extras around the charts.
Power BI, up and running, from $5,000
A fixed-scope Power BI build, from your data to dashboards your team will use. You see exactly what the price covers, and a fair quote for anything more.
Fixed fee from $5,000 | Live in 2 to 3 weeks | Price shown up front
Dashboards your team will actually use
From your data to three working dashboards, deployed and explained.
- Connection to up to 2 data sources
- One clean, documented data model
- Three interactive dashboards or reports
- Row-level security basics
- Scheduled data refresh
- Deployment to a Power BI workspace
- Train-the-trainer enablement
Power BI licences (Pro, Premium Per User, or Fabric capacity) are billed through Microsoft CSP. The $5,000 covers the implementation services.
What is in the $5,000, and what we quote separately
Anything beyond the standard package is optional, and always quoted before you commit.
| In your $5,000 | Beyond the package, quoted at a fair rate |
|---|---|
| Up to 2 data sources | More sources and complex source systems |
| One data model, three dashboards | Additional dashboards and advanced DAX |
| Scheduled refresh | A Fabric or warehouse back end |
| Row-level security basics | Power BI embedded and paginated reports |
| Train-the-trainer | Governance and a centre of excellence |
You pay $5,000 for the standard build. Everything else is optional, scoped and quoted transparently at a reasonable rate, and always shown before you decide.
Power BI done properly
We deliver the model, the reports, and the adoption, because all three are needed for visualisation to stick.
Semantic models
Well-designed Power BI semantic models built on a star schema, with a clean date dimension, sound relationships, and carefully written DAX. Each measure has one definition, so every report and self-service user agrees on what a number means.
Executive reporting
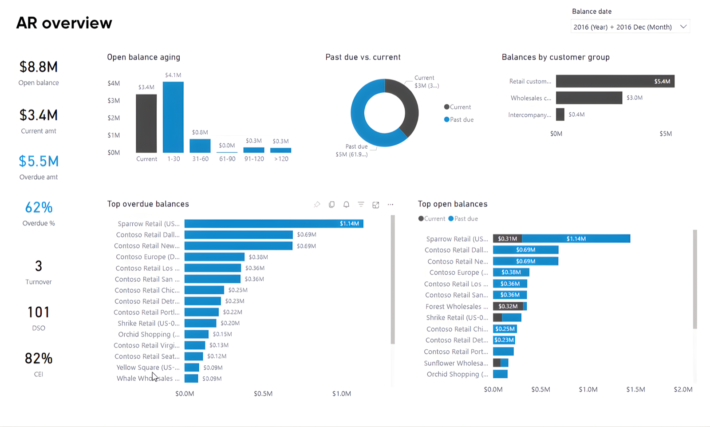
Clear, decision-focused dashboards for leadership: the right metrics with the context to interpret them, and nothing competing for attention. Reports are designed around the decision being made, not around every metric available.
Self-service enablement
Certified datasets, row-level security, and practical training, so business teams build their own reports safely on a trusted, governed foundation rather than each starting from raw data.
Direct Lake and performance
Power BI on Microsoft Fabric in Direct Lake mode: import-level query speed read straight from OneLake, with no scheduled refresh window, so large and frequently-updated datasets stay fast and current.
The semantic model, DAX, and Direct Lake
Good visualisation is built from the model upwards, in a deliberate order.
The semantic model is the reusable data layer beneath the reports: the tables, the relationships, and the DAX measures. We build it on a star schema, fact tables surrounded by clean dimensions, because that structure is what Power BI’s engine is designed for and what keeps reports both fast and predictable. A proper date dimension supports time intelligence such as year-to-date and prior-year comparisons. Get the model right and the visuals become straightforward; get it wrong and no chart will rescue it.
DAX is where measures are defined, and discipline here is what stops dashboards disagreeing. Revenue, margin, active customers, and every other key figure is written once, as a single tested measure, and reused everywhere. There is no second version with slightly different logic hiding in another report. We also keep DAX readable and efficient, because a measure that is correct but slow erodes trust almost as quickly as one that is wrong. One definition per measure is the rule that makes every report agree.
Direct Lake, on Microsoft Fabric, changes the performance trade-off that used to constrain Power BI. Import mode is fast but needs scheduled refreshes, so reports can lag the data. DirectQuery is always current but can be slow. Direct Lake reads Delta tables directly from OneLake and gives import-level speed with no refresh window, so reports reflect the latest loaded data without a copy of the model living inside Power BI. For large or frequently-updated datasets, that removes a long-standing source of staleness and refresh failures.
From data to decisions
Visualisation engagements run through five phases: model first, visuals second, adoption always.
Define
Workshops to capture the real decisions and questions the reports must support. Metrics and their definitions are agreed and written down up front, so the build has a clear and shared target.
Model
Semantic model design: a star schema, a clean date dimension, sound relationships, and DAX measures with one trusted definition each, so consistency is built into the foundation.
Design
Report and dashboard design focused on clarity and on the decision at hand. Layouts are reviewed with real users iteratively, so the reports answer the questions people actually have.
Build
Report development, row-level security, performance tuning, and publication of certified datasets, so the released reports are fast, governed, and clearly marked as trusted.
Adopt
Training, a self-service enablement programme, and adoption tracking, so reports are genuinely used and the investment turns into decisions rather than unopened dashboards.
Why clients choose Veratas for data visualisation
Good visualisation is a modelling problem and an adoption problem before it is ever a chart problem.
Model-first
We build the semantic model properly before any visuals, with a star schema and one definition per measure. Reports then stay consistent and stop contradicting each other as the estate grows.
Designed for decisions
Dashboards are built around the specific decision the user is making, with the metrics and context that decision needs, not around every figure that could possibly be displayed.
Adoption built in
Training and self-service enablement are part of the engagement, not an afterthought. Reporting that nobody opens is not counted as a success, so adoption is tracked and acted on.
Fabric and Direct Lake
Power BI on Microsoft Fabric with Direct Lake: fast at enterprise scale, current without refresh windows, and governed through the same OneLake and Purview foundation as the rest of your data estate.
FAQ
Frequently asked questions
Quick answers to questions you may have. Can't find what you're looking for? Check out our full documentation.
Build Power BI your business will trust
Well-modelled, well-designed, and well-adopted: visualisation that drives decisions instead of debate. Start with a conversation about your reporting goals.
Related reading: enterprise Power BI deployment.