



Power BI for manufacturing
Power BI turns production, quality and supply data into plant dashboards your teams act on every shift. Veratas designs, builds and governs the full deployment, from the semantic model to the screen on the shop floor.
The reporting reality on a modern shop floor
Manufacturers hold more operational data than ever, yet much of it stays trapped in the systems that produce it.
Production data sits across MES, SCADA and historian platforms, ERP holds orders and costs, and quality systems keep their own records. Each tool reports in isolation, so a plant manager comparing output against plan, scrap and downtime is often reconciling spreadsheets by hand. By the time the numbers agree, the shift that produced them has ended.
Power BI changes that by becoming the single reporting layer over those sources. A well built semantic model defines OEE, yield, scrap rate and schedule adherence once, with agreed logic, so availability, performance and quality mean the same thing in every plant. Line operators, quality engineers and the operations director then read from the same definitions rather than competing versions.
The hard part is rarely the chart. It is connecting high frequency machine data to slower moving ERP records, keeping refreshes fast enough to support shift reviews, and making dashboards trustworthy enough that people stop checking the source system. That is an engineering task, and it is the work Veratas does before a single visual is placed on a page.
Where Power BI earns its place in manufacturing
These are the reporting problems manufacturers ask us to solve first.
OEE and line performance
Track availability, performance and quality by line, cell and shift, with downtime broken out by reason code. Teams see losses as they happen rather than in a report compiled the following week.
Quality and scrap analysis
Bring inspection results, non-conformance records and scrap costs into one model. Pareto and trend views expose the defects and stations driving rework, so corrective action targets the real cause.
Production against plan
Compare actual output to the schedule across plants in near real time. Planners and supervisors see slippage early and can rebalance work before a customer order is put at risk.
Plant and shop-floor dashboards
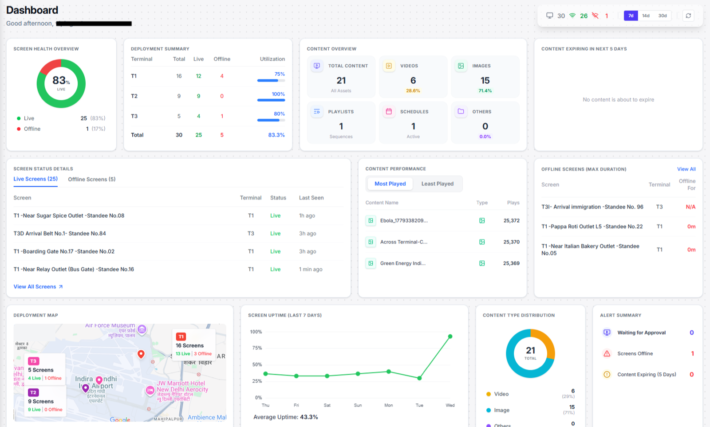
Publish dashboards to large screens on the floor and to tablets for line walks. The same governed numbers reach the operator, the shift huddle and the executive review without rekeying.
Supply, inventory and cost
Join ERP inventory, supplier delivery and cost data to show stock cover, material variance and the production cost behind each order, supporting both operations and finance.
How Veratas delivers Power BI for manufacturing
A delivery approach built for plant data, not generic business reporting.
Map sources and metrics
We work with operations and IT to inventory MES, historian, ERP and quality sources, then agree exact definitions for OEE, yield, downtime and scrap so every plant measures the same way.
Engineer the data foundation
We model production data in Microsoft Fabric, using Direct Lake where volumes are high, so high frequency machine data and ERP records meet in one reliable, fast semantic model.
Build dashboards and paginated reports
We design role based dashboards for operators, supervisors and executives, plus paginated reports for shift handover and audit, all reading from the governed model.
Deploy, govern and support
We size capacity, set refresh schedules, configure workspaces and row level security by plant, and hand over with training, or run the platform for you as a managed service.
FAQ
Frequently asked questions
Quick answers to questions you may have. Can't find what you're looking for? Check out our full documentation.
Related industry solutions
Other ways Veratas applies Microsoft and data engineering to industry-specific challenges.
Power BI for healthcare
Power BI gives healthcare organisations governed reporting on patient flow, clinical activity and operational performance.
Power BI for financial services
Power BI gives financial services firms governed regulatory, risk and performance reporting they can stand behind.
Microsoft Fabric for manufacturing
Microsoft Fabric unifies plant, sensor and supply chain data in one lakehouse so manufacturers can see production performance in real time.
Make every shift visible
Talk to Veratas about a Power BI deployment that gives your plants trustworthy production, quality and OEE reporting under one accountable team.